Figure description
Combined time series of gravity wave potential energy from Rayleigh lidar at OHP and COSMIC (5° × 5° domain centered at OHP).
White areas represent the missing data. a) Monthly-mean Ep (color map) and zonal wind (solid contours - westerly winds of 30 and 80 m/s, dotted contour - zero wind, dashed contour - easterly wind of 10 m/s). b) Weekly means of Ep from COSMIC and lidar (color map) and monthly means of MERRA Ep (from Khaykin et al. 2015)
Data are provided by LATMOS: S. Khaykin and A. Hauchecorne
Gravity waves (GW), are known to play a major role in the energy and momentum budget in the middle atmosphere, and their influences on the atmospheric structure and circulation have been recognized (Fritts and Alexander, 2003). Rayleigh lidar provides vertical profiles of the total density of the atmosphere from about 30 km to 90 km depending on the signal-to-noise ratio and it is a powerful tool for the study of atmospheric perturbations. Lidars produce accurate observations with high temporal and spatial resolution, well adapted for studying atmospheric GW. GW activity, in terms of potential energy (Ep), is estimated by analyzing raw lidar signals with a variance method.
The GPS radio occultation (RO) temperature profiling technique, featuring high vertical resolution and global coverage, represents a powerful means for studying the sources and climatology of GWs. Operational since April 2006, COSMIC GPS RO system, consisting of 6 low Earth-orbiting micro-satellites, provides 1500-2000 occultations per day with sampling density maximizing at mid-latitudes, this provides about 1-2 profiles per day in a 5° x 5° bin at OHP latitude.
The figure above displays the resulting 7 year time series of GW Ep vertical distribution above OHP between 10 and 50 km altitude. The Ep time series reveals a distinct pattern with GW activity maximizing throughout the stratosphere during the winter, which is during the maximum westerly winds above 20 km. In addition, there is a notable interannual variability both in the lower and upper stratosphere. One can see a week-to-week variability of COSMIC Ep, which is discernible even during summertime midstratosphere GW depression.
As the middle atmosphere dynamics play in an important role in both tropospheric weather and climate, characterizing the spatio-temporal distribution of GWs opens perspectives for new parameterization schemes in numerical weather prediction systems. The analyses of the ARISE data also allowed characterizing GW and their effects on the mean circulation since GW cannot be resolved directly by current global circulation models due to their sub-grid scales.
The first ARISE multi technology site is the Observatoire de Haute Provence (mid latitude, FR) where a NDACC lidar is in operation, providing high quality data.
A four elements infrasound array was installed by CEA for the ARISE 2013 observation campaign.
The station is still in operation, providing high quality infrasound data.
Additional instruments complete the observations during the campaigns.
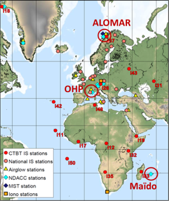
This multi instrument station is an ARISE reference station. Other reference stations are Maïdo observatory in tropics (tropics, FR) and ALOMAR observatory (polar region, NO).